Student dashboard
Last updated: July 28, 2026
Summary The dashboard provides insight into learning behavior and results across courses, featuring triggers and motivation for the student (to take more ownership) and serving as a basis for the coach to use data for interim evaluations. Value The student dashboard offers clear and more relevant insights into the student's activity and progress. Roles
|
The student dashboard in a nutshell
In StudyCoach, students, coaches, and education coaches can view the dashboard per student.
StudyCoach aims to stimulate self-regulated learning. The dashboard provides more value to students and coaches in the process of helping students take ownership of their own learning and progress toward success. With clear and more relevant insights into student activity and progress, StudyCoach offers practical tools for students and coaches.
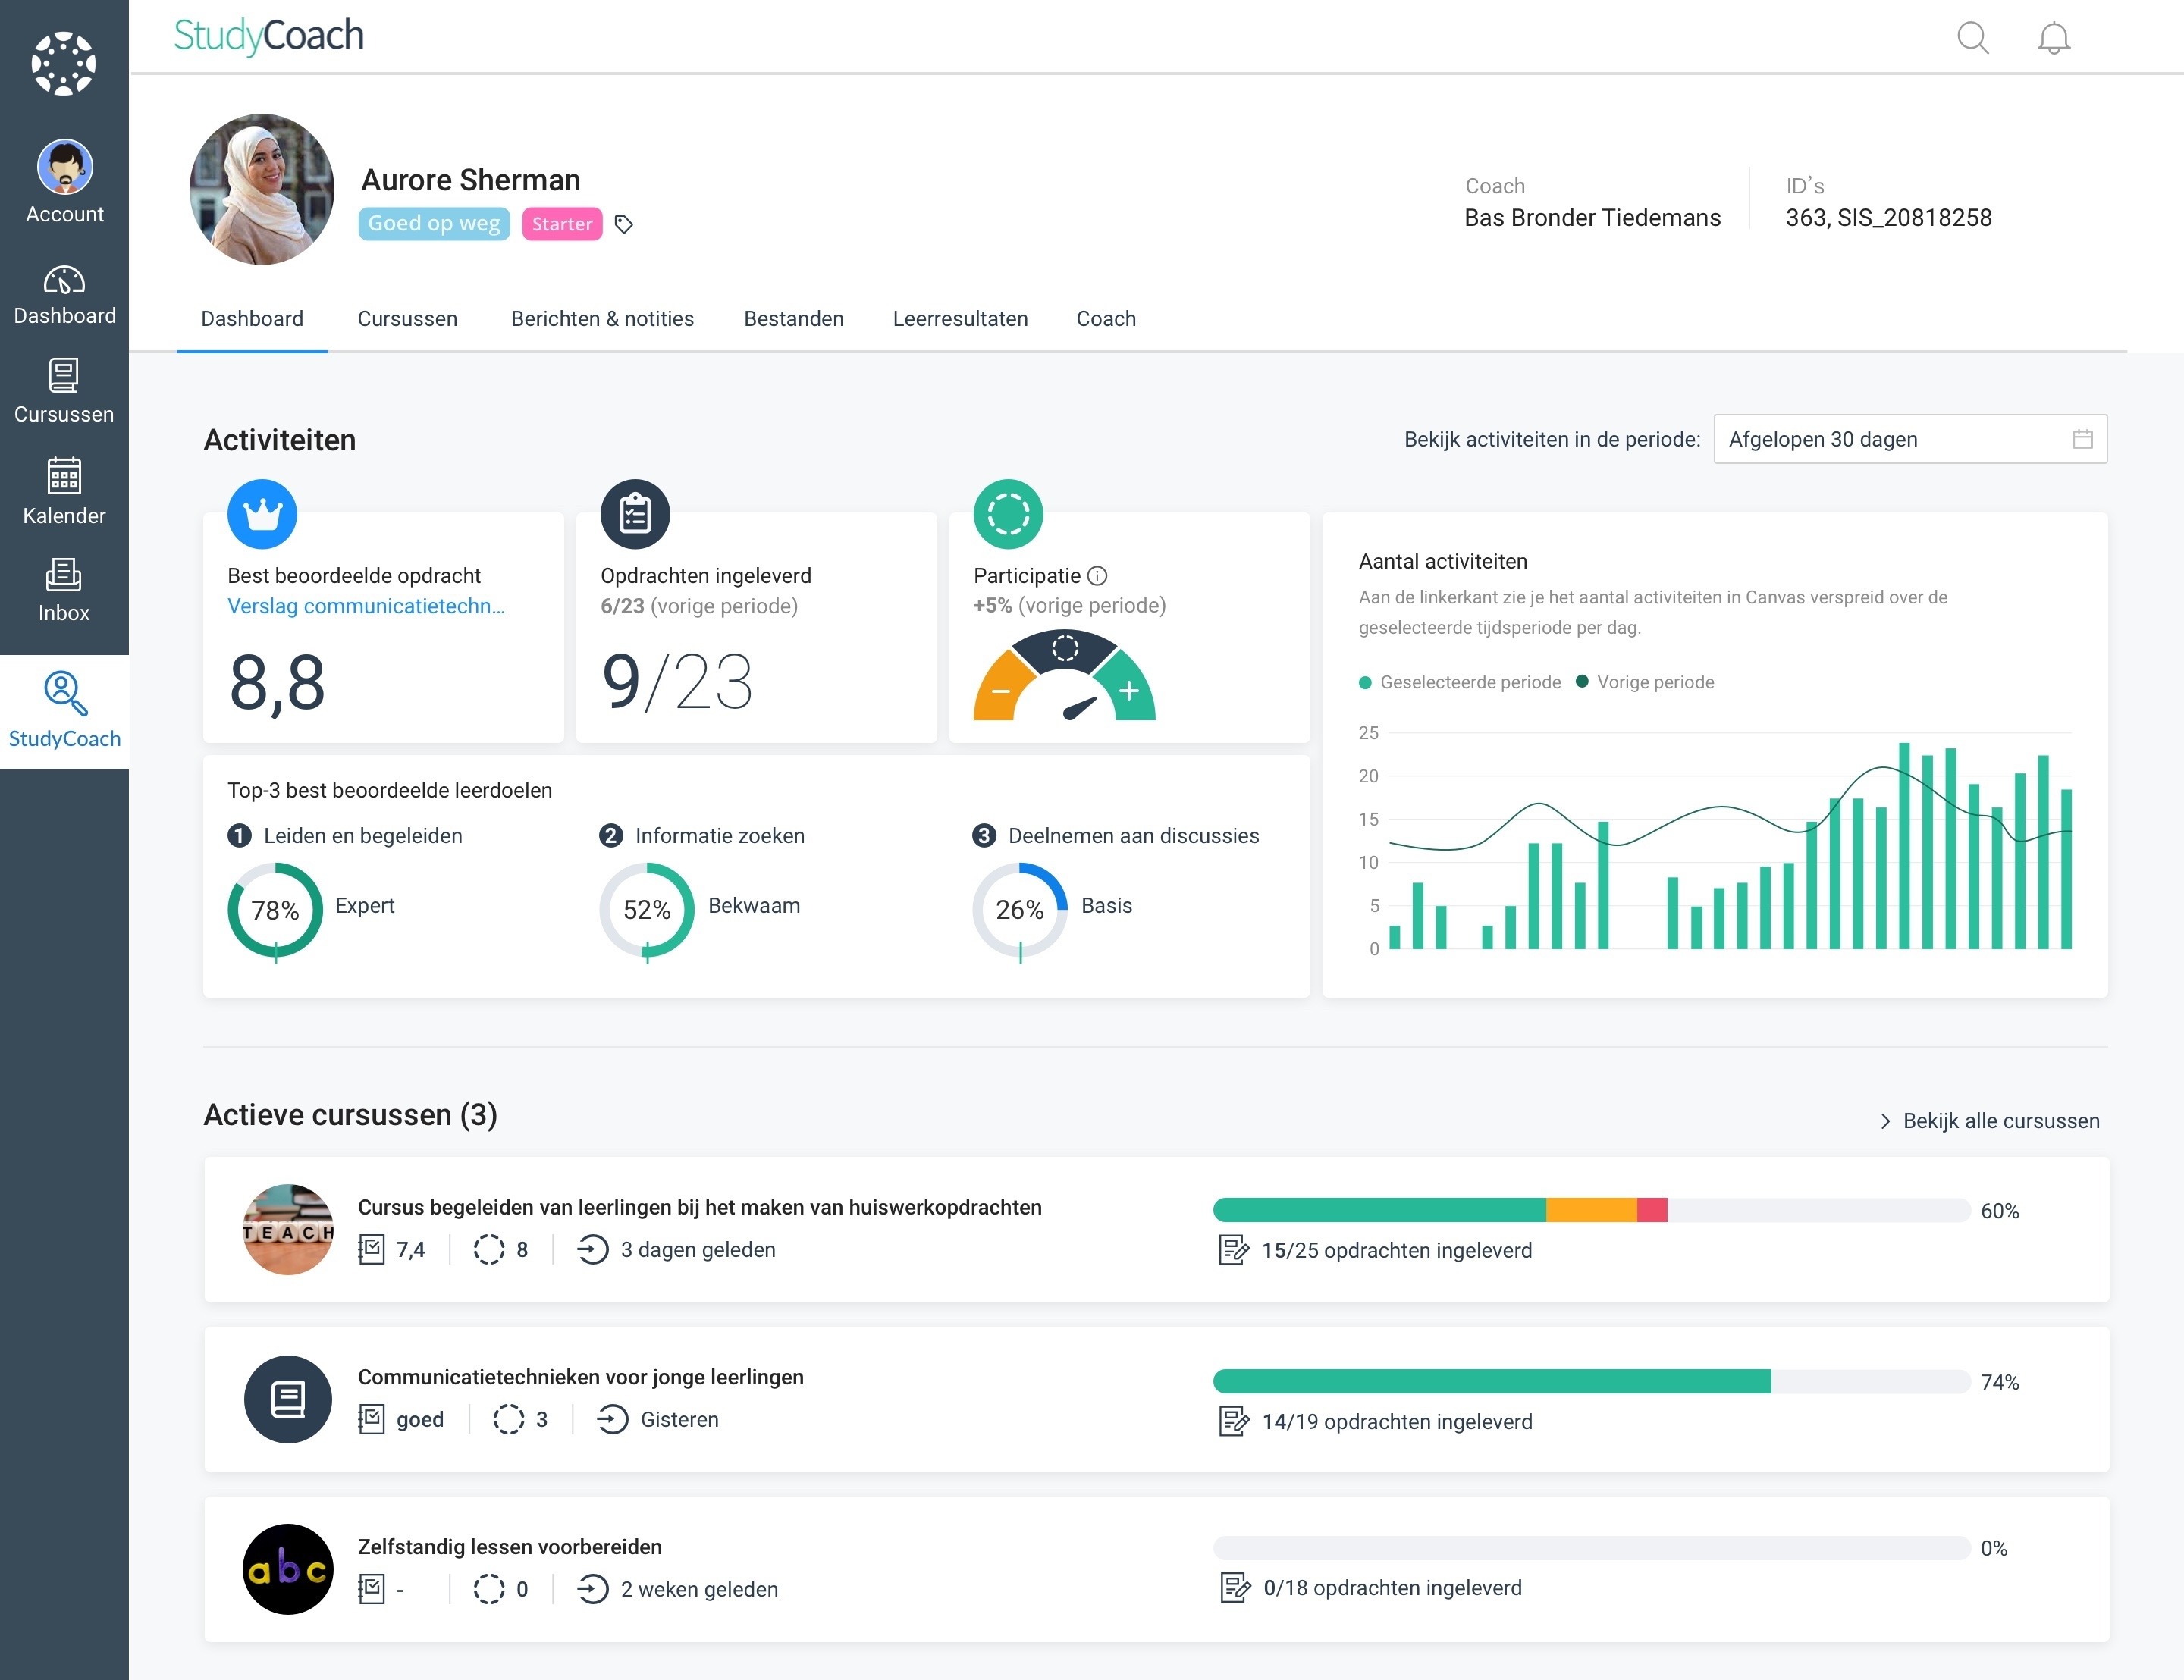
The image below shows the student dashboard from a coach's perspective. A coach sees this per student. For the student themselves, this is the landing page of StudyCoach.
Ipsative comparisons
Ipsative means self-referential. In the StudyCoach dashboard, the student's activities are compared with activities from previous periods. In situations of increasing diversity in educational pathways and flexible education, this provides much more relevant insights than comparing data with other students in a group, because every student has personal learning experiences and activities.
Focus on motivation and ownership
Acknowledging successes and growth is a crucial component of the dashboard to motivate the student and increase the application's appeal to them.
Insight into activities, courses, and learning goals
The dashboard provides insight into three clear components of learning outcomes: activities, courses, and learning goals.
Activities: Offers a summary of relevant data to provide insight into learning activities in Canvas.
Courses: Provides insight into progress and a number of statistics, such as the current grade, number of participations, and the number of submitted assignments.
Learning goals: For each group of learning goals (e.g., learning outcome or work process), the mastery of underlying learning goals, and thus the progress toward mastery, is shown in a radar chart.
Activities
Best rated assignment
The highest-rated assignment in the selected period. In the backend, grades are converted to a percentage so that assignments scored 1-5, insufficient-sufficient-good, 0-10, or 1-12 can still be compared. The name of the assignment links to the assignment in Canvas. If there are no grades in the period, this area remains empty. Note: To see assignments here, data synchronization for 'Submission behavior' must be enabled. With the 'Grades' permission (in 📄 Permissions), you can configure which roles and accounts can see this block. If the permission is disabled for all accounts where the student is enrolled in a course, this block will not be visible.
Assignments submitted
The number of assignments submitted in the selected period / number of assignments with a deadline in the selected period. If there are no assignments with a deadline in this period, this area remains empty. If the 'Submission behavior' permission is disabled, this block will not be visible.
Participation
Participation in the selected period compared to the previous period as a percentage, calculated using the absolute number which can also be seen in the tooltip. If there has been no activity in the selected period, this area remains empty. If the 'Participation & page views' permission is disabled, this block will not be visible.
Number of activities
The number of activities in Canvas distributed over the selected time period per day/week. Activities are a sum of participations (interactions and page views) just like in Canvas Analytics.
Top learning goals
The Top 3 best-rated learning goals in the selected period. The color is based on the percentage of the levels and/or whether mastery has been achieved or not (blue vs. green (achieved)). If there are fewer than 3, an empty state is shown here. If the 'Learning outcomes' permission is disabled, this block will not be visible.
Are you a manager and want to know more? Check out the article 📄 Canvas data synchronizationand the article 📄 Permissions.
Active courses
All courses with active enrollments in the current or active period are displayed here. The activity period filter does not affect this. All displayed information comes from the Canvas course. The following is shown per course:
Course image: If an image is set for the course in Canvas, it is also displayed in StudyCoach.
Course name
Current final grade: The current final grade for the course. Students or observers can click through to the grades in the Canvas course to see how this is calculated. StudyCoach adopts the course's grading scheme.
Participation: The number of participations in the course as an absolute number. If there is no participation (yet), a 0 is shown here. If the 'Participation & page views' permission is disabled for this account, this element will not be visible.
Assignments (submission behavior): Progress in the number of published assignments within the course (regardless of whether they count toward the final grade or not). Features the number of open assignments in gray and the number of submitted assignments (regardless of the grade) in green and in percentages. For assignments with a deadline: Submitted late is in orange. Not submitted/missing is in red (not submitted does not count either). Assignments marked 'No submission' or 'On paper' count as submitted as soon as a grade is given. If someone is 'excused', an assignment also counts as submitted. When an assignment receives an insufficient grade, it counts as submitted and therefore appears in green in the submission behavior.
View all courses: Link to the tab with all of the student's course enrollments.
Learning goals
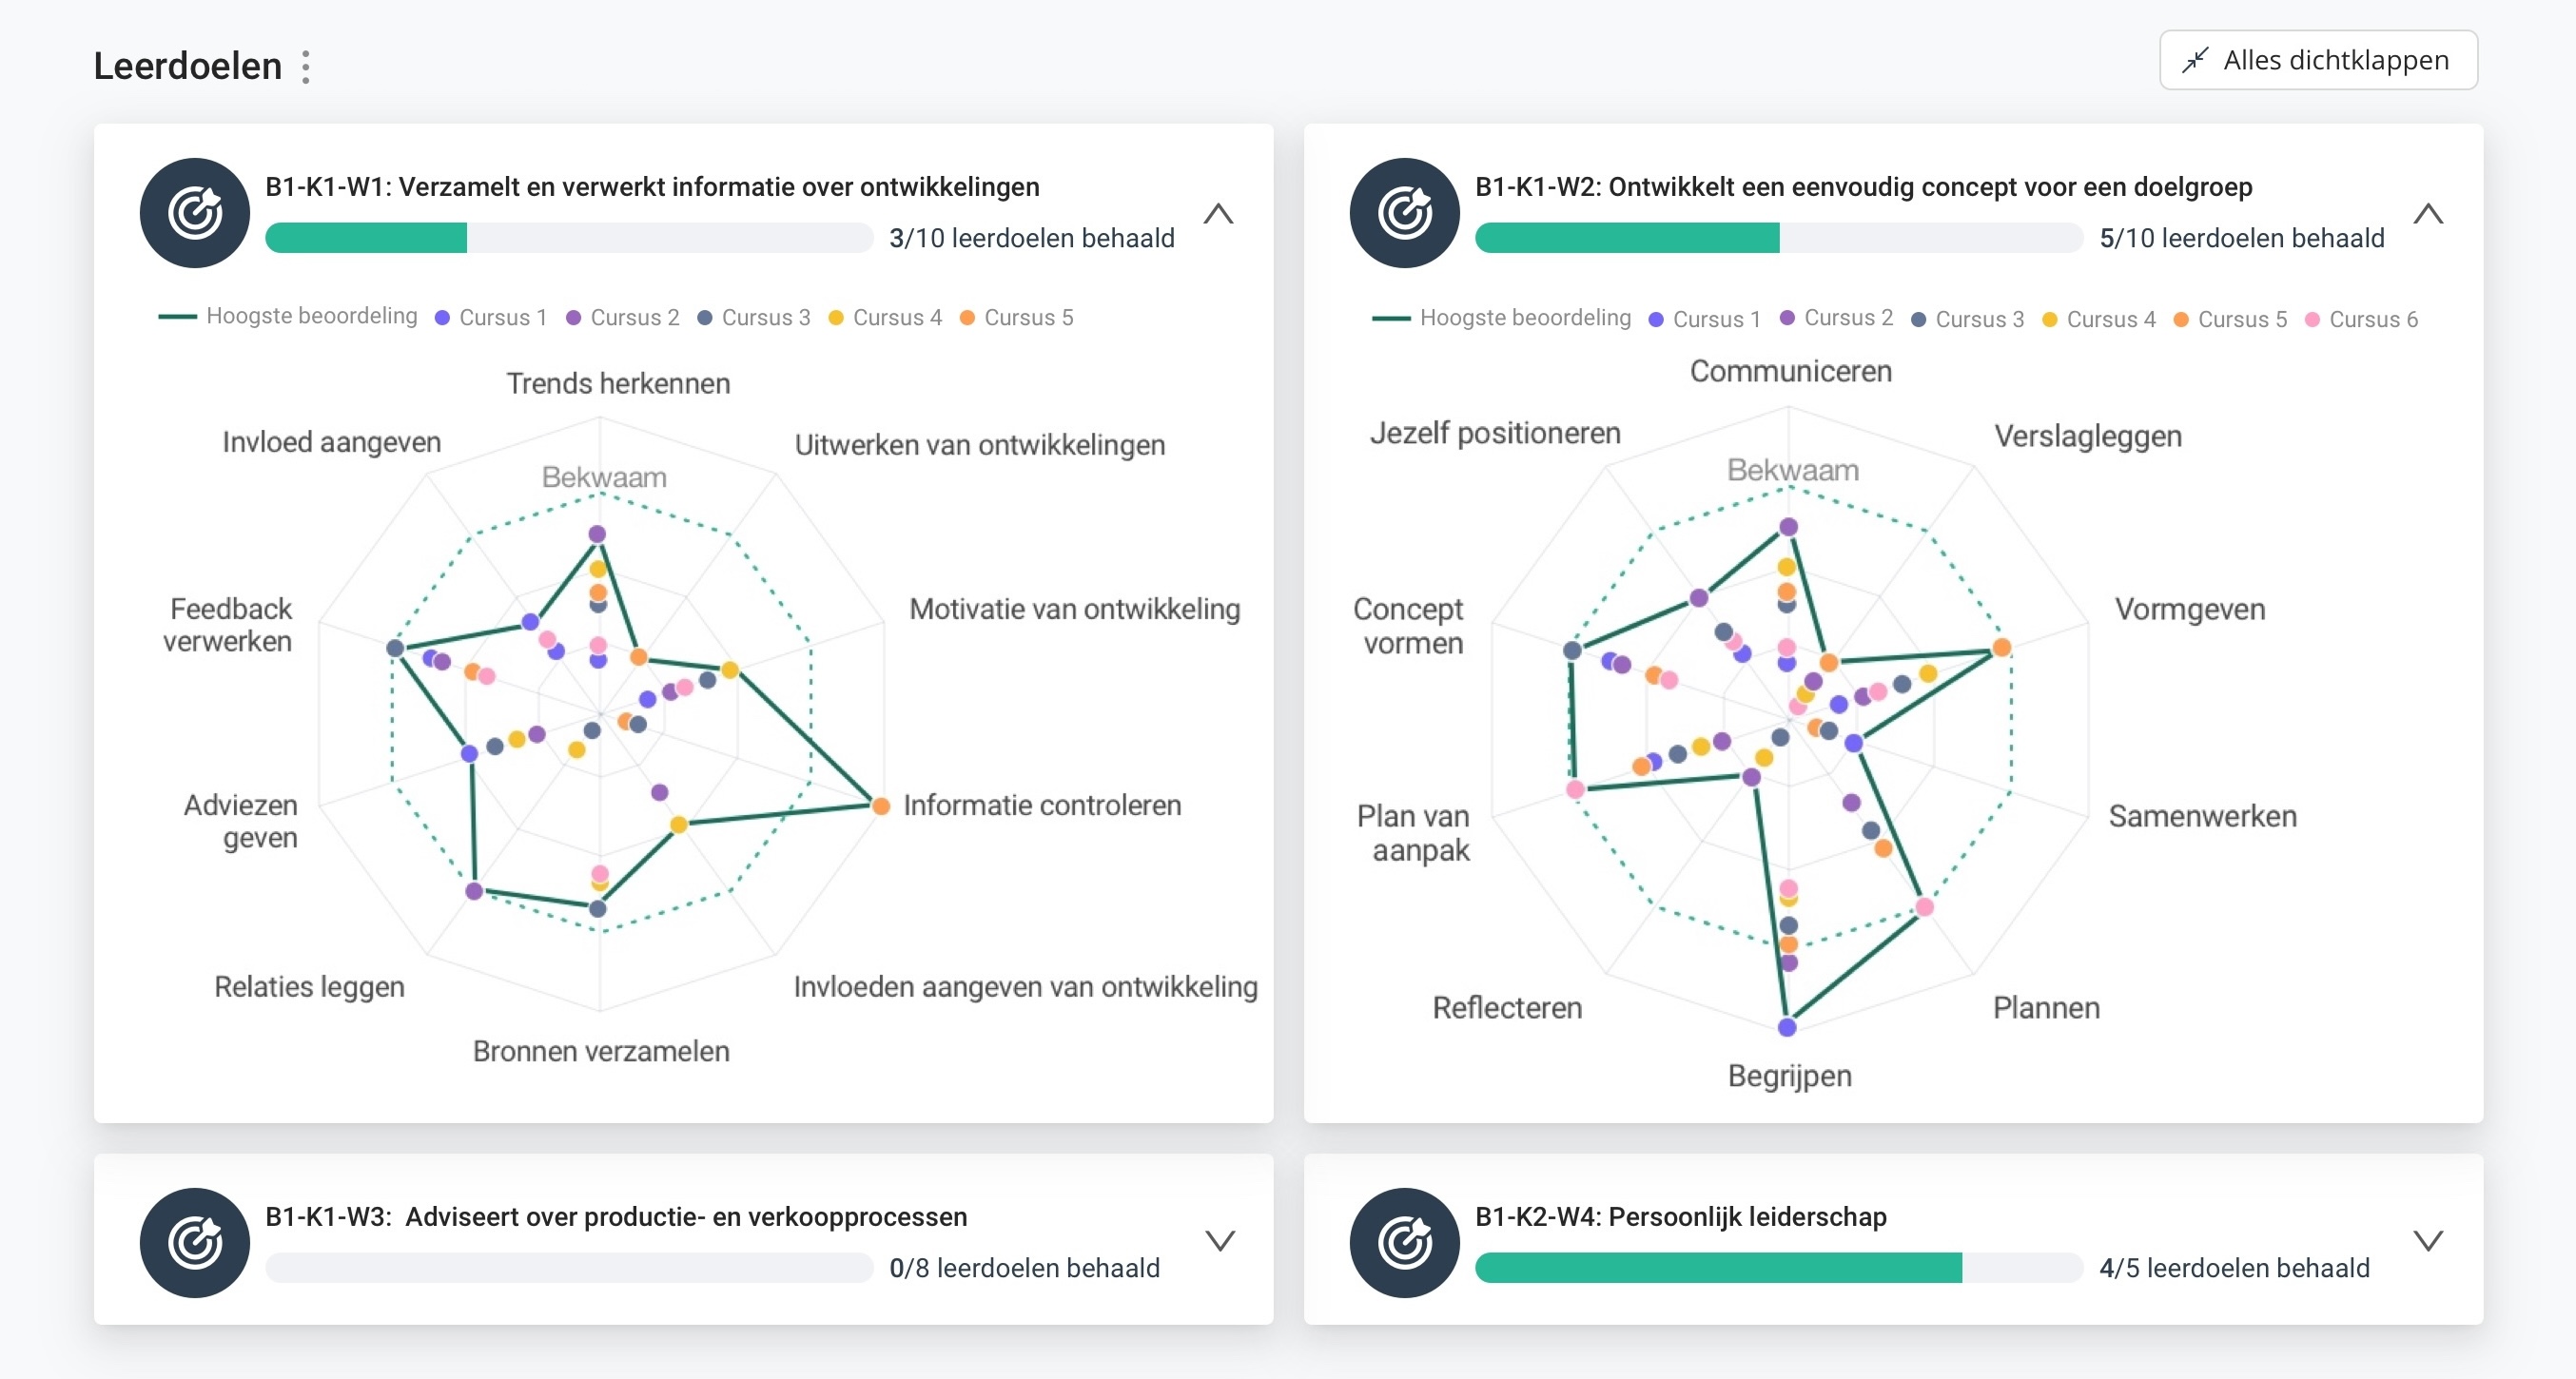
All lowest-level learning goal groups linked to a student's courses are displayed here. Each group consists of multiple learning goals. Next to the name, you can see the number of achieved learning goals under the group. One diagram is shown per group. The learning goals under the group are on the axes. The circle indicates the level of mastery. Each point shows the current final grade of the learning goal per course.
To ensure this component aligns as well as possible with flexible education, the student and (education) coach can configure themselves whether the following elements are shown or not:
The connecting line between the highest grades.
The progress bar with the number of achieved learning goals (based on the highest grade per learning goal).
Expanding or collapsing all learning goal groups by default.